Technical Support and Innovation Services
Component 1 strengthens PFI capacity for rural outreach and builds MSME and smallholder investment capacity and financial literacy.
Read more: Technical Support and Innovation ServicesThese are remembered on this device for the rest of your visit.

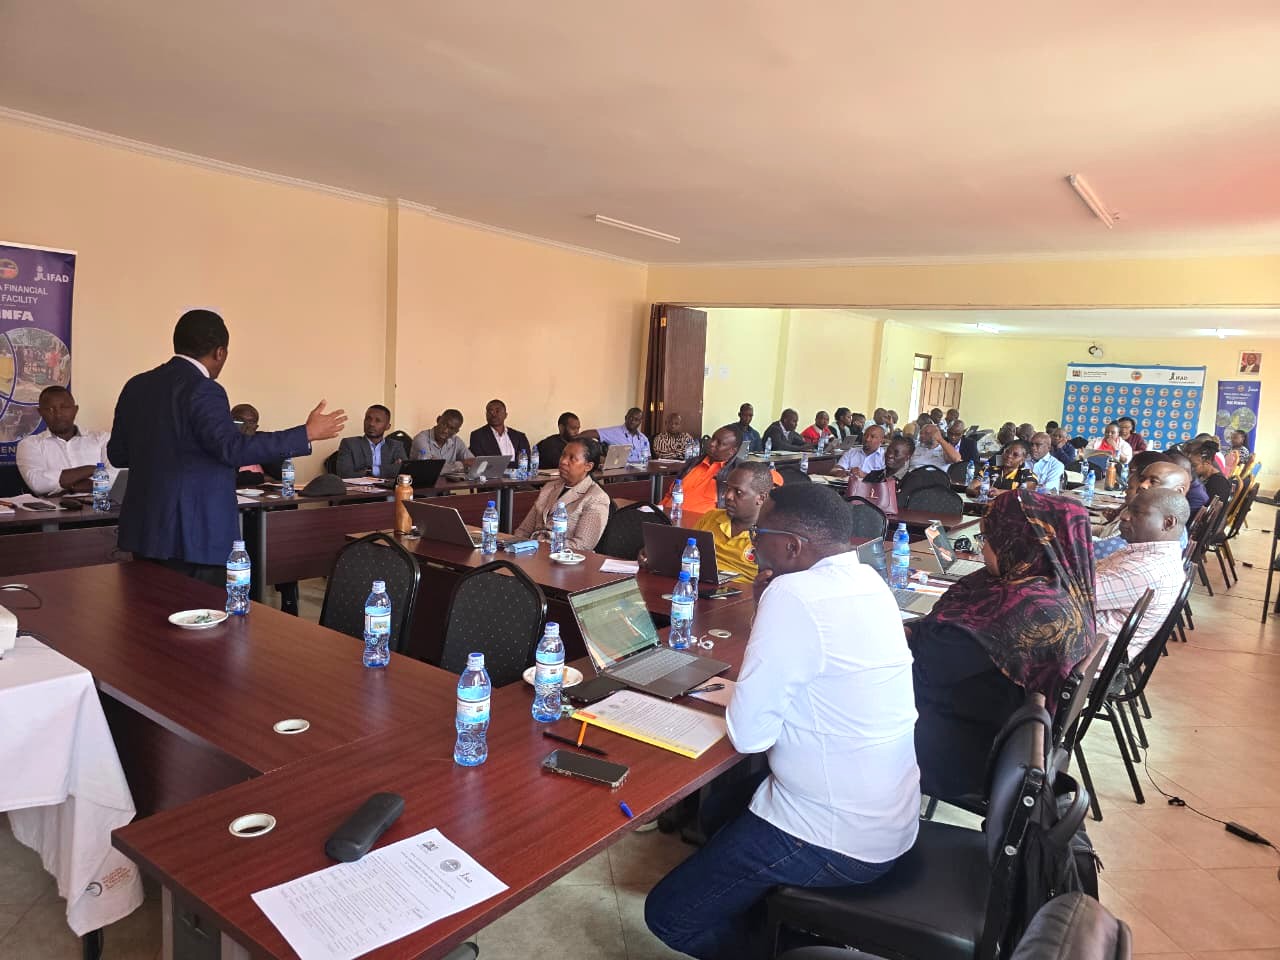
The RK-FINFA Project Management Unit (PMU), in collaboration with implementing partners, conduct the Annual Stakeholder Review and Learning Workshop
The investment, the reach and the timeline of the facility.
Public progress data for each RK-FINFA component, updated September 2026.
PFI Capacity Building for Rural Outreach and Innovation
29%
Financial service providers supported in outreach strategies - 2 MFIs, 5 SACCOs and 5 commercial banks
Rural Credit Guarantee Scheme (R-CGS)
100%
PFIs contracted under the R-CGS - 5
Business Development Services for Agribusinesses and Smallholders
64%
Rural enterprises (MSMEs) accessing business development services - 960 MSMEs
Business Development Services for Agribusinesses and Smallholders
68%
Persons in rural areas trained in financial literacy and/or use of financial products and services (smallholder farmers outreach) - 33,991 Smallholders
GFF Credit Access
36%
Persons in rural areas accessing GFF - 8,026
GFF Credit Access
23%
Financial institutions implementing GFF - 7
GFF Credit Access
35%
Women and youth-specific products developed and deployed by SACCOs and MFBs under GFF - 7
Results reach 14 counties; open a tab above to see each indicator on the map.
County boundaries: geoBoundaries / RCMRD GeoPortal (2020).
Business Development Services for Agribusinesses and Smallholders
64% of target
County boundaries: geoBoundaries / RCMRD GeoPortal (2020).
Business Development Services for Agribusinesses and Smallholders
68% of target
County boundaries: geoBoundaries / RCMRD GeoPortal (2020).
GFF Credit Access
36% of target
About the facility
RK-FINFA is a six-year development project financed jointly by the International Fund for Agricultural Development (IFAD) and the Government of Kenya (GoK). It supports the transformation of the rural and smallholder agriculture sector through private sector-led development by improving the access of smallholder farmers and rural micro, small and medium enterprises to appropriate financial services.
The facility contributes to the Bottom-up Economic Transformation Agenda (BETA) 2022–2027 through the Rural Credit Guarantee Scheme and the Green Financing Facility.
Reduce poverty, enhance climate change adaptation and improve livelihoods in rural areas.
Increase rural financial inclusion and green investments by agriculture value chain stakeholders.
66,000 smallholder households and 2,000 rural MSMEs as direct beneficiaries.
A minimum of 50% women and 30% youth across all capacity building and financing activities.
What we do
Component 1 strengthens PFI capacity for rural outreach and builds MSME and smallholder investment capacity and financial literacy.
Read more: Technical Support and Innovation ServicesRK-FINFA operates two rural investment instruments: the Rural Credit Guarantee Scheme (R-CGS) and the Green Financing Facility (GFF).
Read more: Rural Investment InstrumentsComponent 3 promotes policies and institutional arrangements that support medium and long-term development of rural finance.
Read more: Enabling Rural Finance Environment and Project CoordinationRisk sharing that promotes rural outreach innovations and catalyses funding from Kenyan mainstream financial institutions into the rural and agriculture sector — KES 2.8 billion invested to leverage KES 11.5 billion in PFI lending.
A permanent investment mechanism with start-up capital of KES 2.1 billion that encourages small-scale farmers and micro-firms to invest in climate-smart and environmentally friendly activities.
News · 30 Sep 2026
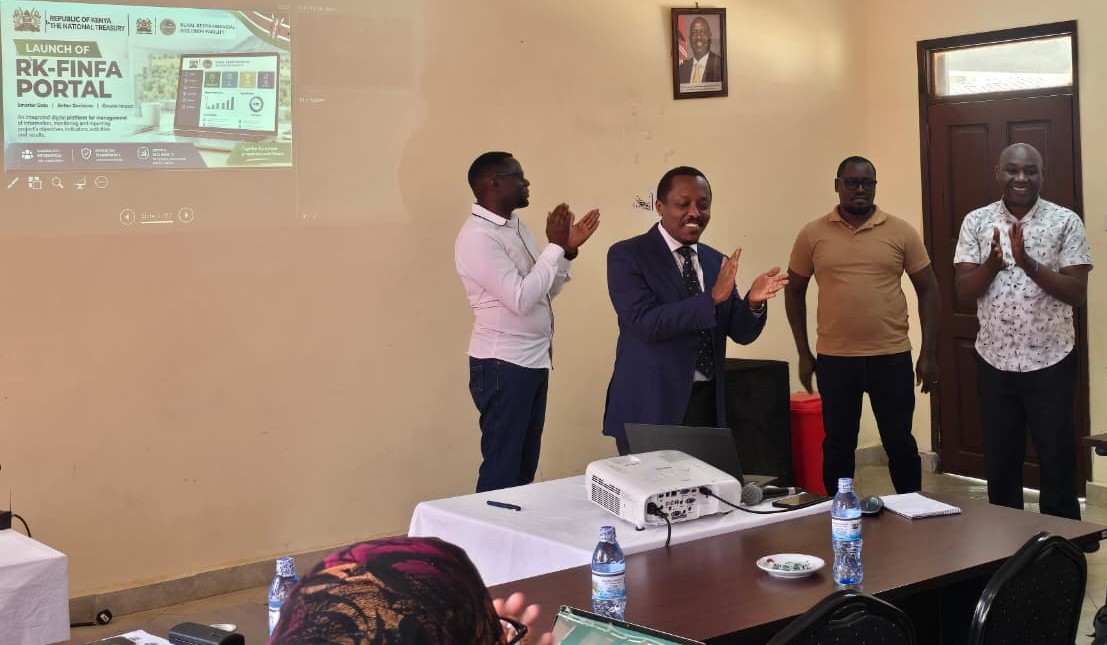
In line with the Government digital transformation agenda, RK-FINFA has developed a Project Management Portal to provide an integrated digit...
Read more: Commissioning of the RK-FINFA Portal by Albert K. Mwenda, Director General, Budget, Fiscal & Economic Affairs (BF&EA) on the Behalf of the Principal Secretary – The National Treasury - SeptemNews · 18 Sep 2026
The Government of Kenya (GoK) and International Fund for Agriculture Development (IFAD) undertaking a joint full supervision mission
Read more: The Government of Kenya (GoK) and International Fund for Agriculture Development (IFAD) undertaking a joint full supervision missionNews · 18 Sep 2026
RK-FINFA conducting capacity building training and reflective learning workshop for the implementing partner,
Read more: RK-FINFA conducting capacity building training and reflective learning workshop for the implementing partnerNews · 17 Sep 2026
Business development services and financial literacy training are rolling out to 50,000 smallholder producers.
Read more: Financial literacy training reaches smallholder producers across entry counties Agricultural Finance Corporation (opens in a new tab)
 Credit Guarantee Schemes (opens in a new tab)
Agence Française de Développement (opens in a new tab)
Credit Guarantee Schemes (opens in a new tab)
Agence Française de Développement (opens in a new tab)
 Foreign affairs of Finland (opens in a new tab)
 International Fund for Agricultural Development (IFAD) (opens in a new tab)
 Central Bank of Kenya (opens in a new tab)
 SASRA (opens in a new tab)
 Kenya Bankers Association (opens in a new tab)
 FSD Kenya (opens in a new tab)
 AGRA (opens in a new tab)
 Cordaid (opens in a new tab)